Environmental design support tools *)
Contents
3 TYPES OF TOOLS AND CONTEXT OF APPLICATION
3.1 Environmental design criteria for thermal comfort
3.2 Weather data and climate analysis
3.3 Solar access and solar control
3.4 Daylighting
3.5 Thermal properties
3.6 Space Heating and cooling requirements
3.7 Air flow in and around buildings
3.8 Other energy uses
*) modification of a review paper of Simos Yannas, Architectural Association School of Architecture, London, United Kingdom.
Rising environmental awareness and stricter building regulations have fostered continuous improvements in the environmental performance of buildings. Many new buildings and refurbishment schemes are now claimed as satisfying criteria of environmental sustainability in terms of embodied and operational energy use, CO2 emission, occupant comfort and indoor air quality. How credible are such claims ? how low is low-energy ? can we make accurate predictions of occupant comfort conditions and likely energy consumption of a building before it is built ? Over the last twenty years large and continuous increases in computational power have encouraged the development of software tools designed to help designers and environmental engineering consultants make such predictions. Here, the following aspects of such tools are dealt with:
![]()
Energy use, indoor air quality and occupant thermal and visual comfort in buildings are largely influenced by decisions taken in the early stages of design, often by choices made even before design commences. For example, the choice of site and early decisions relating to site layout, building form and room orientation can determine sunshine conditions in and around a building and the ensuing potential for the use of solar energy for heating and / or for electricity generation. The use of specialised analytic tools such as those illustrated here can inform design decisions, helping to assess the likely environmental implications of different design options as these are being considered, and providing the means for setting performance targets for new buildings and refurbishment schemes.
Figure 1: Aspects of using environmental design support tools.
The application of environmental design support tools has to be considered at different stages, before, during and following design as described below.
Some of the available tools were developed specifically for use at early design stages and may have limited application in detailed design development, whilst others are geared toward detailed analysis. Few of the available tools deal with all of the tasks and operations encompassed by environmental design and some were designed to deal specifically with only one or some of these processes. The most widely used from among the tools that deal with thermal analysis have become increasingly more designer-oriented aiming to address both three-dimensional visualisation (and thus also studies of solar access and shading design) and the processes of natural ventilation and solar gain that are of critical importance in contemporary building design. With increasing computer power there has been a continuous trend of integration and greater capability. Calculations that needed to be run overnight a few years ago are now performed in a few minutes. Nevertheless, there is still discrepancy between designers' conception of realism and accuracy and that possible by the application of most of the current tools. Ironically, this discrepancy is reinforced by the improvements mentioned above. For example, a tool might allow 3-D visualisation of shadows and take account of the shading of surfaces on its calculations of incident solar radiation, but completely ignore the daylighting aspects of solar radiation in buildings. Practically useful and reasonably accurate results can be produced even with the simplest tool provided users understand the processes involved and the capabilities and limitations of the tool. It is especially important to be clear about what processes are ignored and the likely effects on results. Clearly users must have an understanding of the underlying structure and theoretical basis of the tools they use, Fig. 2.
Figure 2: Purposes of using environmental design support tools.
Table 1 presents a checklist of key issues and criteria relating to the choice and application of different analytic tools in building design. The first section of the table relates to what a tool does, how it operates and what its results mean. The second section addresses a tool's ease of use and applicability to environmental design. The third section focuses on issues of cost and support which are critical for the decision of whether to invest in such tools.
| |||||||||||||||||||||||||||||||||||||||||||||||||||
| Table 1: Environmental Design Support Tools: selection and evaluation criteria | |||||||||||||||||||||||||||||||||||||||||||||||||||
![]()
3 TYPES OF TOOLS AND CONTEXT OF APPLICATION
The following are design tasks and operations which can benefit from the use of specialist computational tools for further analysis:
These tasks are briefly reviewed here and selected tools are listed under each of these categories. Examples are given illustrating the application of some of the tools. The selection of tools presented here is not intended to be comprehensive, but focuses on tools that are tested and widely used.
![]()
3.1 ENVIRONMENTAL DESIGN CRITERIA FOR THERMAL COMFORT
The values expected of the environmental variables (air temperature, mean radiant temperature, relative humidity, air movement) for typical clothing and activity have been the subject of national and international standards. There is also continuing research and debate regarding how best to encompass these variables into a comfort zone or index that takes account of individuals' adaptive capabilities and behaviour. Fanger's (Fanger 1970) Predicted Mean Vote (PMV) and the Percentage of People Dissatisfied (PPD) are widely used, as well as being widely criticised. PMV measures thermal sensation on a seven point scale from hot to cold on either side of a neutral point (neither hot nor cold). PPD is the proportion of a population that is likely to be dissatisfied with the thermal environment at any given PMV. The American Society of Heating Refrigerating and Air-conditioning Engineers' ASHRAE 55-92 Standard defines an acceptable thermal environment as one which would be acceptable for at least 80% of its occupants; this is equivalent to a PPD of 20% or lower, and PMV of +/- 0.85. The International Standards Organisation ISO 7730 defines thermal comfort conditions as being represented by PMV of between +0.5 and -0.5 (PPD 10 percent). A slightly different, adaptive model of thermal comfort was postulated by Humphreys (Humphreys 1978) and Auliciems (Auliciems and Szokolay 1997) based on data from different buildings around the world showing that the sensation of neutrality varies as a function of the outdoor air temperature. As the applications of IDEA refer mainly to the mid- or north-European climate, only such tools are considered which are based on Fanger´s theory.
Publications
Applicable Software
Example Applications
The figure below illustrates the use of the second software tool listed above (COMFORT PMV Calculator, Butera), which is identical with the corresponding tool in IDEA. The input data are: air temperature of 20°C, mean radiant temperature of 19°C, air velocity of 0 m/s, relative humidity around 60%, clothing of 1.1 clo and metabolic rate of 66 W/m² (= 1.2 met). The resulting PMV value is - 0.4 and the PPD is about 8%. This outcome would be considered as satisfying wintertime thermal comfort criteria in most residential, commercial and educational buildings for which the clo and met values quoted above mostly apply.
 |
| Fig. 3 Graphical display of the Comfort PMV Calculator (Butera 1995). |
![]()
3.2 WEATHER DATA AND CLIMATE ANALYSIS
Weather data are needed for most of the analytic operations in environmental design. For example, heat loss calculations make use of monthly or hourly values of outdoor air temperature; more detailed calculations may require the use of wind data (velocity and direction) as well. The calculation of solar heat gains requires values of incident solar radiation data on surfaces of different orientation and slope. The same data may be required for assessing the potential energy yield from solar water heaters or from photovoltaic panels. Other variables of interest to designers may include relative (or absolute) humidity, sky luminance, soil and tap water temperature. Thereby, such sets of weather data usually should represent the typical, long-term behavior of weather at the given location, the climate, and not any particular meteorological event.
Climate data may be required in the form of daily or hourly values. Monthly averages of mean daily air temperatures and solar radiation are commonly sufficient for simplified calculations of space heating at early stages of design. Hourly values are required for dynamic thermal simulation which allows more accurate predictions (taking account of heat storage effects) as well as estimations of hourly loads and indoor temperatures. Test reference periods and eather years have been compiled for many locations to allow designers to test their designs under different conditions. These include sequences of typical, as well as more extreme, summer and winter conditions.
Some of the software tools used for thermal analysis provide their own weather files with the type of data needed for their operation. However, the number of locations encompassed by those files is often limited. Where weather data can be obtained from other sources they can be then introduced by the user in the format needed by the tool being used. Presently the problem of missing data can be solved with the aid of the Meteonorm software which can produce weather data for almost any location (see below and Appendix).
Applicable Software
Example Applications
Figure 4 shows the locations of weather stations and cities in Europe, North-Africa and Near-East for which the Meteonorm database has measured datasets. For the purpose of IDEA, only the mid- and north-European stations are relevant. There exists an abundant number of such stations.
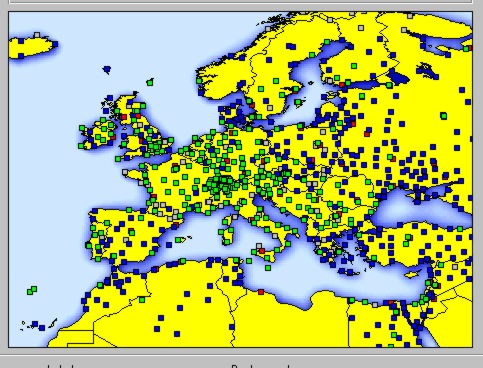 |
| Figure 4: Meteonorm screen showing weather stations and
city locations in the program's database. |
![]()
3.3 SOLAR ACCESS AND SOLAR CONTROL
For indoor and outdoor spaces in which sunshine is welcome at times, ensuring access and avoiding or minimising overshadowing is of particular concern especially on urban sites. Conversely, solar control is a key concern in all situations where solar radiation may lead to thermal discomfort and/or overillumination and glare indoors or outdoors. Such studies can be undertaken at the design stage on scaled physical models with an heliodon, or with computer models. Currently, most of the widely used CAD software provide users with the means of shadow projection based on light sources that emulate the sun angles. In addition, there are several dedicated computer programs, as well as some that are interfaced with thermal and lighting analysis software. Both types of software can allow users to study aspects of solar access and solar control at the scale of site layout, building form and internal planning, as well as for detailed design of openings and solar control devices. In all cases some knowledge of solar geometry is essential.
Publications
Applicable Software
Example Applications
The figures below illustrate example applications using some of the software
listed above.
 |
| Figure 5: Sunpath diagrams for the geographic latitude of 50° from SUNPATH/ENERCAD/IDEA in different ways of presentation (cylindrical, spherical projection). |
 |
| Figure 6: Simulation and animation of shadows cast by overhang (ENERCAD, NESA, SHADOW in IDEA). |
 |
| Figure 7: Simulation of a settlement with SOLCITY. |
 |
| Figure 8 Simulation of the shading situation at a building's south-facing facade with SOMBRERO. |
![]()
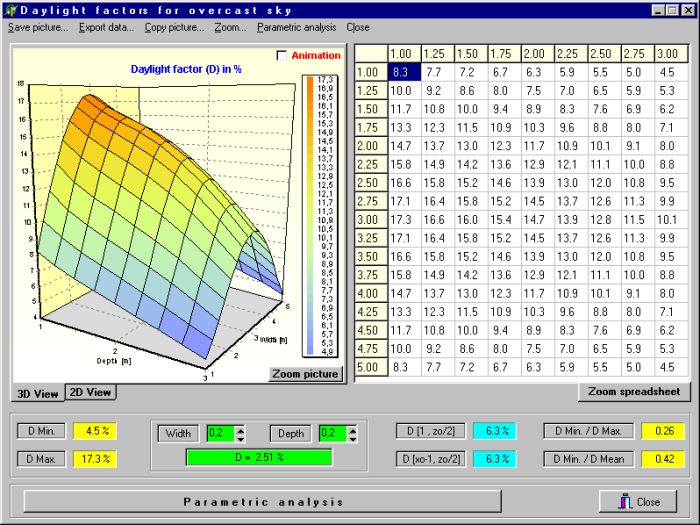
Daylight is admitted into rooms through external windows, clerestories, and rooflights. It is often also "borrowed" from adjacent spaces through openings in separating partitions. The amount of light reaching a point in a room through any opening reduces the further away the point is from the opening. Depending on room heights, room depths of 6-9 metres represent the limits for daylight penetration. The addition of rooflights, and borrowed daylight from adjacent spaces, are common ways for supplementing incoming daylighting from windows in areas furthest from the external perimeter of a building.
Predictions of the likely availability of daylight in a room can be made at the design stage with a computer model, or using a scaled physical model in an artificial sky. Size, geometry, and location of openings and the reflectances of room surfaces are the main controllable design parameters. Simple calculation procedures ignore the direct sun considering daylighting only under an overcast sky. The rationale of this is that if a room is adequately lit when the sky is overcast, it will be better lit at times of higher sky illuminance. Daylight calculations under the assumption of overcast sky are considerably simplified and results are commonly expressed in the form of a daylight factor (the ratio of illuminance at a given point indoors to that received on an unobstructed horizontal plane outdoors expressed as a percentage). For a Standard Overcast Sky (sky luminance of between 5,000 and 20,000 lux), a daylight factor of 1-4% corresponds to average illumination values of 100-1,000 lux on the working plane (at a height of some 0.80 m from the floor). This range encompasses lighting requirements for most common uses in buildings. For offices and school classrooms, illumination levels of 300-500 lux on the working plane are adequate for typical tasks. In northern Europe where overcast sky conditions may occur at any time of the year, a space achieving an average daylight factor of 4% is generally expected to provide satisfactory daylighting for office and classroom use.
Failing to provide adequate daylighting results in heavy reliance on artificial lighting, as well as in daylight deprivation. Artificial lighting has a high penalty in electricity consumption and overall environmental impact owing to the high CO2 emission of electricity generation (nearly three times higher rate of CO2 emission than other fuels). Additionally, use of artificial lighting adds to cooling loads and thus potentially to thermal discomfort, or where air conditioning is used for space cooling to further use of electricity to power the air conditioning appliances.
Publications
Applicable Software
Example Applications
The figures below illustrate results obtained using some of the software listed above.
 |
| Figure 9: Daylight factors calculated by DIAL shown on plan of room. |
  |
| Figure 10: Lightscape simulation (left) compared with photograph of real building (right). |
 |
| Figure 11: DAYLIGHT simulation output showing illuminance levels on working plane height of a room with window and rooflight. |
![]()
The thermal and solar-optical properties of building elements are fundamental to most calculations and indices of thermal performance. Composite properties such as the thermal transmittance (K-value or U-value) of individual building elements, the mean thermal transmittance of the building envelope, and a building's overall heat loss coefficient are useful indicators of the rate of heat transfer through the building envelope. The thermal capacity of building elements and that of the building structure as a whole provide indication of a building's thermal inertia and capacity for heat storage. A simple measure of a building's ability to store and release heat over the daily cycle is given by the thermal admittance (Y-value) of its internal surfaces. For standard constructional specifications most of these properties are given in tables published by national and international organisations. There are also several computer programs that provide databases of material properties as well as the means for calculating composite properties such as the thermal transmittance and admittance. Some of these are listed below.
Thermal bridges are regions of relatively high heat flow conductance in a building envelope. Thermal bridges are categorised into four major groups:
Combinations of the above mentioned types are also possible. For further information on thermal bridges see Thermal insulation.
Since the mid-1970's there has been also a body of work on embodied energy and on the environmental impact of building materials. Embodied energy is the energy spent in the course of production and transportation of materials. The energy cost of construction, maintenance and demolition of buildings and disposition or recycling of materials and waste can be also estimated in the same way.
Publications
Applicable Software
Example Aplications
The figures below illustrate example applications using some of the software listed above.
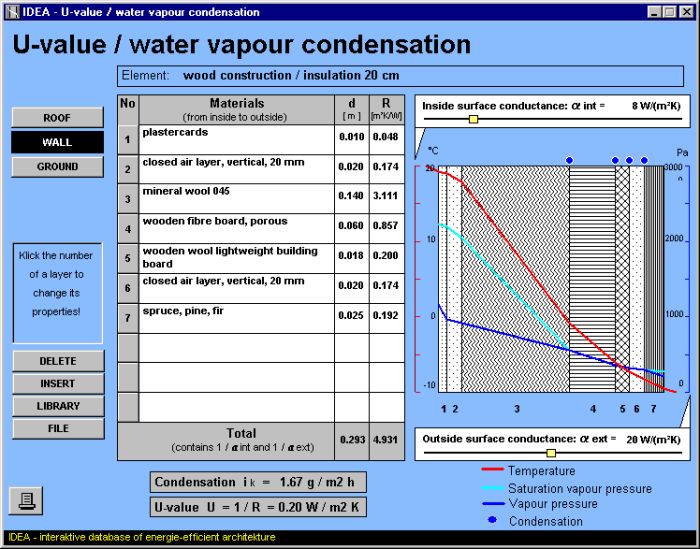 |
| Figure 12: Wall U-value calculation screen including water vapour condensation (IDEA). |
  |
| Figure 13: Temperature isotherms across window glass and frame section (THERM) |
![]()
3.6 SPACE HEATING AND COOLING REQUIREMENTS
Given sufficient information on the geometric and constructional characteristics of a proposed building and appropriate weather data for its surrounding external environment, it is possible to predict the likely space heating and cooling energy requirements and the internal temperatures in different zones of a proposed building under different operational conditions of occupancy. Such predictions provide a means of comparing, assessing and fine-tuning designs. The effects of window size and orientation, of varying material properties and thermal insulation levels can be assessed by repeating the calculations using different values for these parameters. Sensitivity to weather conditions, occupancy schedules and other operational parameters (ventilation rates, thermostat settings, internal gains, etc.) can be investigated and designs modified accordingly. Results can be compared with published energy targets and thermal / visual comfort standards. For the purpose of IDEA only such climates are relevant, where the yearly heating season lasts for at least three months.
The best potential for assessing all aspects of thermal simulation is provided
by "dynamic" tools, where time-dependent calculations of the temperature
field in the building are performed. From this, heat flows and energy balances
can be determined for every considered period of time. If the energy balance
of a building has to be known for a longer period only (monthly or per season)
and no other information (such as required heat load at a specific time, or
periods of overheating) must be calculated with high accuracy, also quasi-stationary
methods similar to that of EN 832 are adequate tools for sufficient results.
Publications
Applicable Software
Simplified monthly / annual energy requirements
Dynamic thermal simulation models
Example Aplecations
The figures below illustrate example applications using some of the software listed above.
 |
| Figure 14: Daily sequence of climatic and heat technical variables (TRNSYS). |
 |
| Figure 15: Monthly Energy Balance (TRNSYS). |
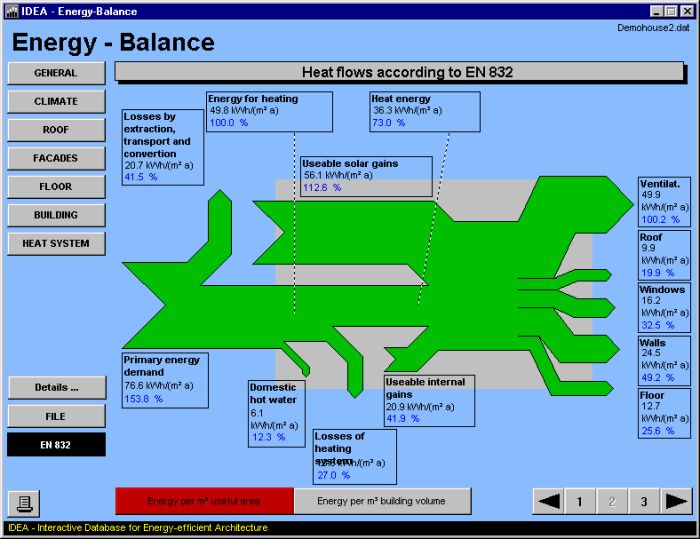 |
| Figure 16. Seasonal balance (ENERGY BALANCE / SANKEY). |
![]()
3.7 AIR FLOW IN AND AROUND BUILDINGS
Air flow patterns inside and around a building are influenced by topography and site conditions, by wind direction and velocity, by temperature difference, and by building and opening geometry. The physical processes involved are complex. Predictions of air flow may be obtained with a wind tunnel, or other techniques involving physical models, or using computer models based on network techniques or on computational fluid dynamics (CFD).
In the warm period of the year increasing the ventilation rate of a building at night can provide a mechanism for dissipating excess heat accumulated within the building structure during daytime. This option is of particular interest in southern Europe or during the summer season in mid-Europe where daytime temperatures are high and ventilation imposes a cooling load during this period. The cooling potential from night-time ventilation depends on the air exchange rates that can be achieved and the temperature difference between inside and outside. Air exchange rates under different design conditions (temperature differences, inlet and outlet characteristics, etc.) can be calculated using the appropriate network modelling techniques. Where the air exchange rate is known, or where likely values of air exchange rate can be assumed, the influence ventilative cooling may exert on indoor temperatures can be assessed using dynamic thermal simulation models (of the kind listed above).
During the heating season the ventilation rate of a building is critical for
its consumption of heating energy. Calculations of air flows due to wind exposure
can help to optimize building design with respect to orientation, zoning of
rooms and their thermal comfort. CFD modelling of ventilation units in individual
rooms gives information about ventilation effectiveness, indoor air quality
and optimum ventilation design features.
Publications
Applicable Software
Example Applications
The figures below illustrate example applications using some of the software listed above.
 |
| Figure 17: CFD output from TAS Ambiens module. |
 |
| Figure 18: Flovent CFD output for IAQ due to a room ventilation unit. |
![]()
 |
| Figure 19: Potential for electricity generation from installing PV panels on building surfaces (ENERCAD). |
 |
| Figure 20: Earth heat exchanger performance data (GAEA). |
A wide range of tools has become available to inform and support the environmental design of buildings at various levels of complexity and detail. This review has looked at the main areas of application of such tools and illustrated the use of some widely used tools. The review includes an annotated list of tools and other design support aids.